
Turn reporting into diagnosis
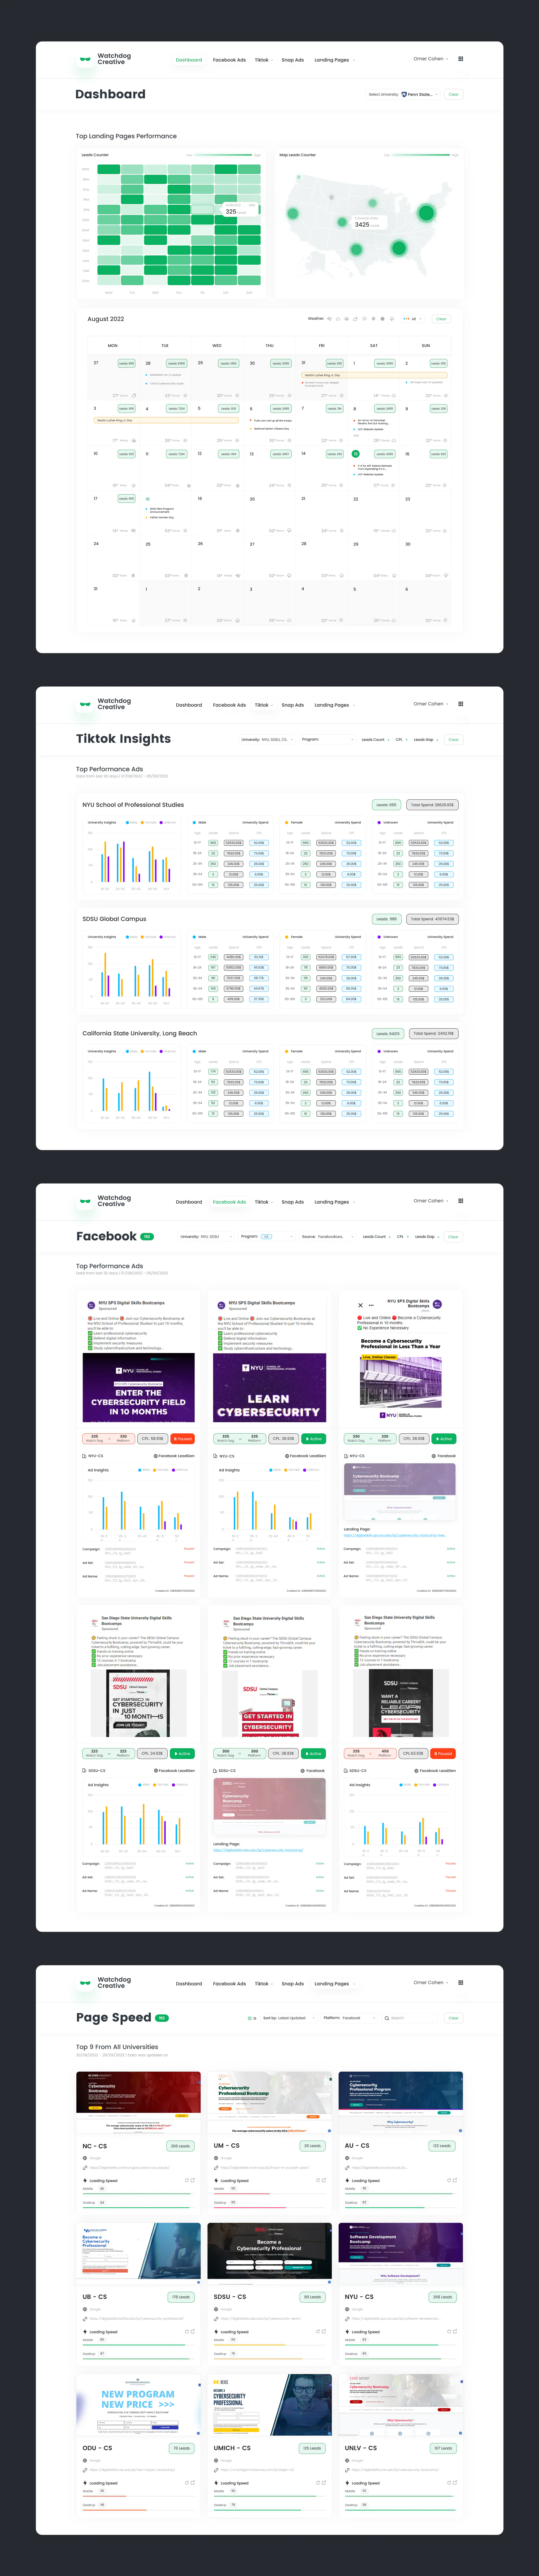
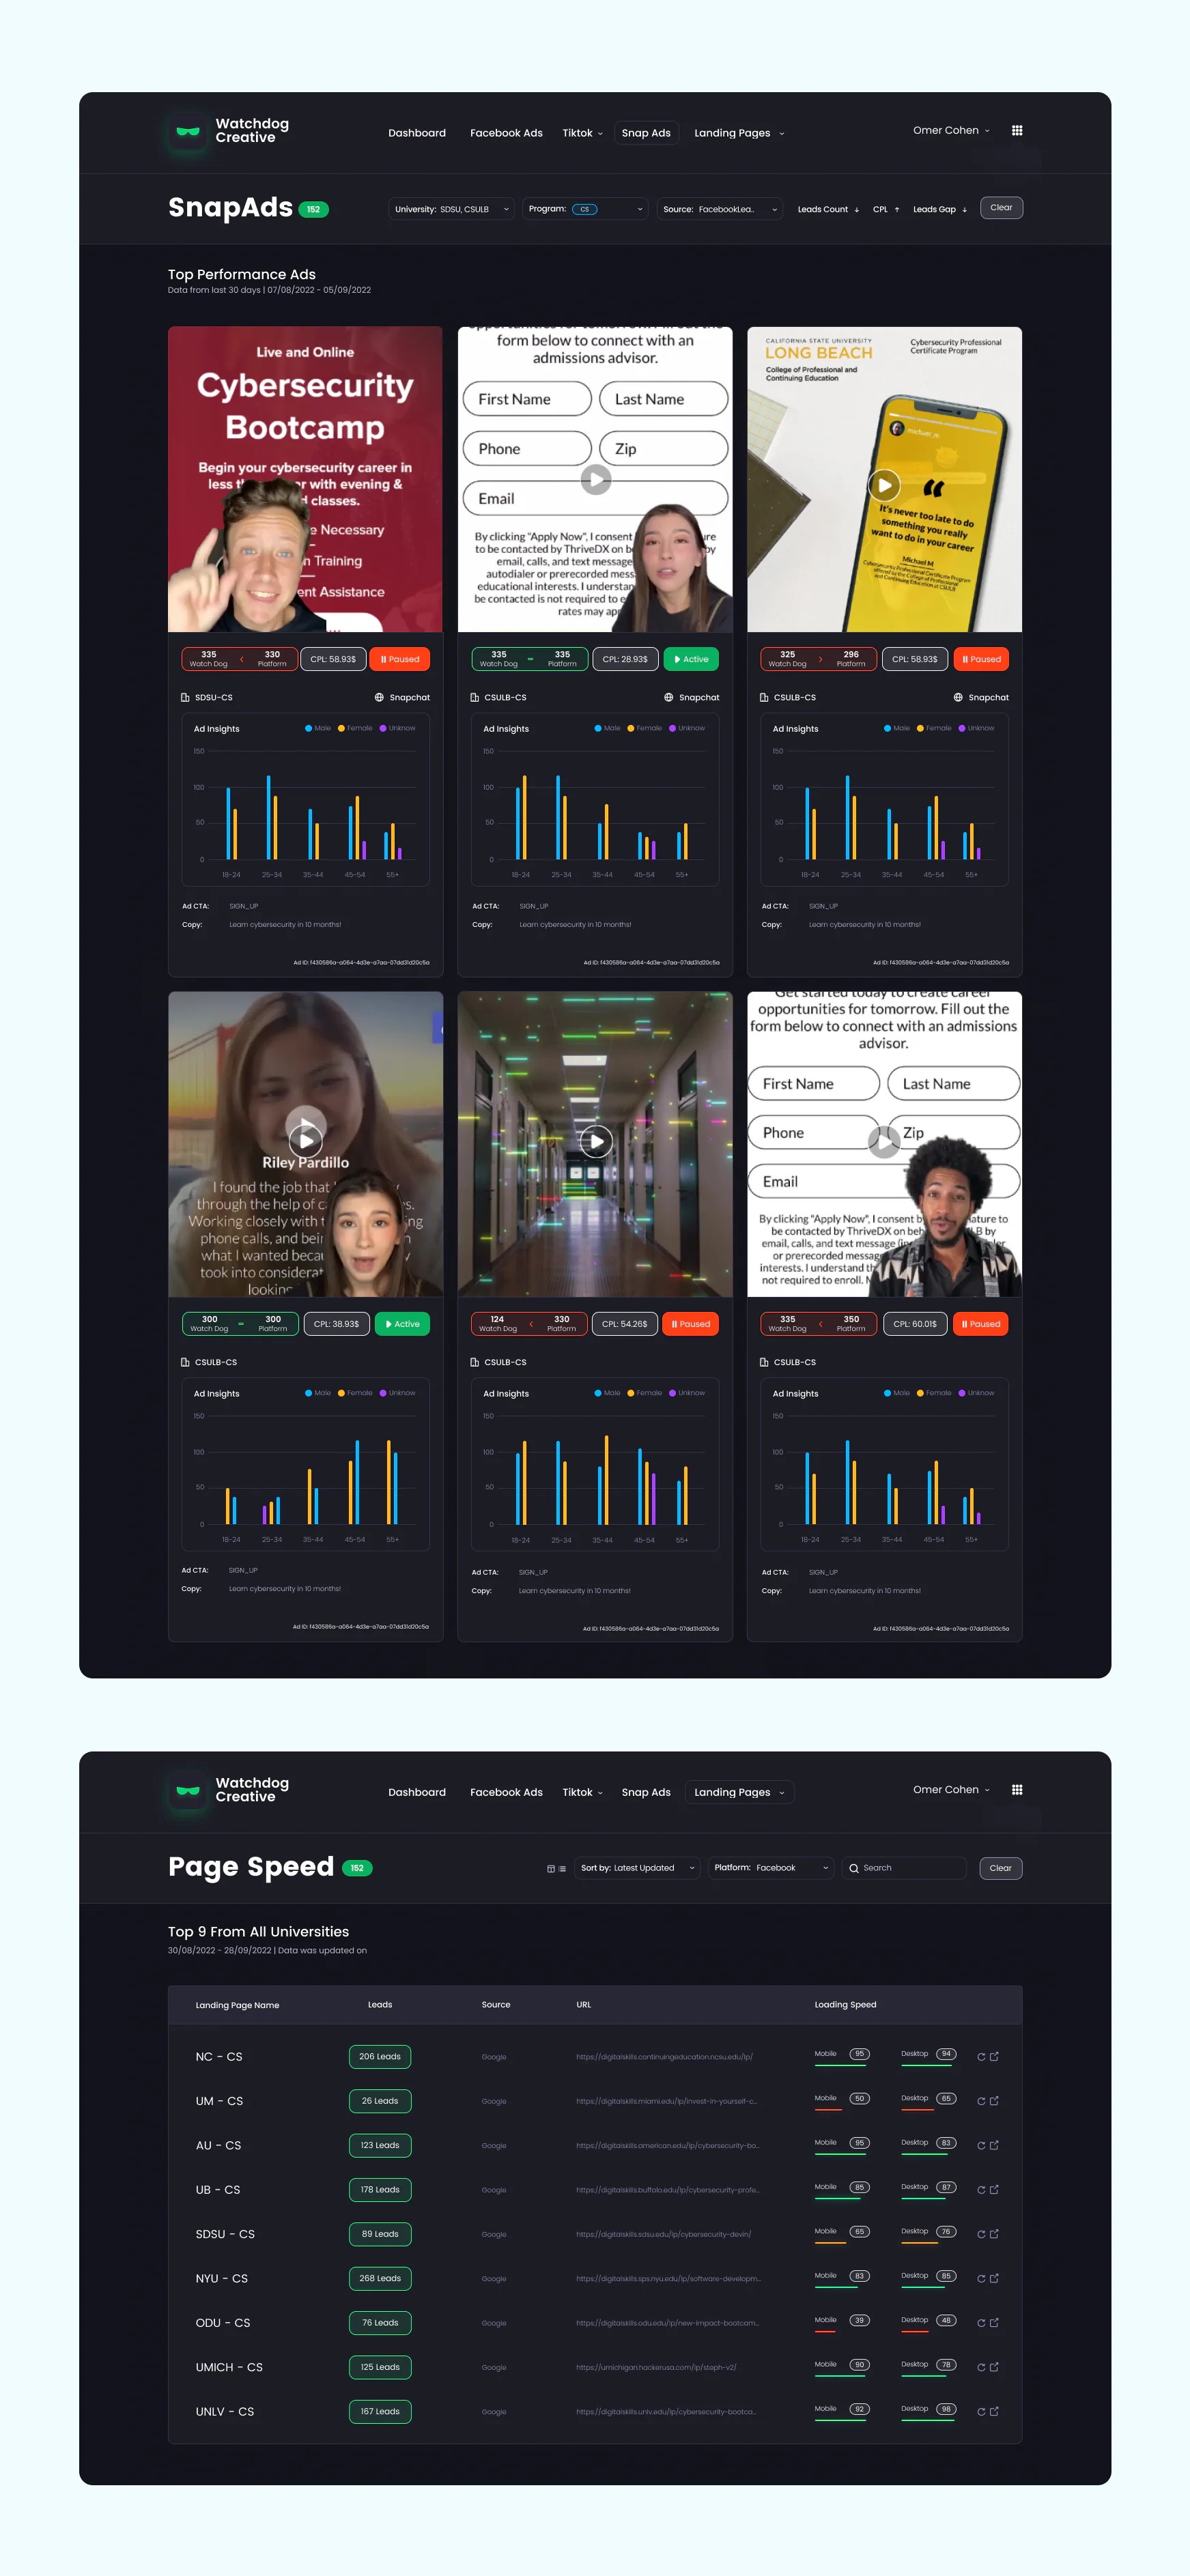
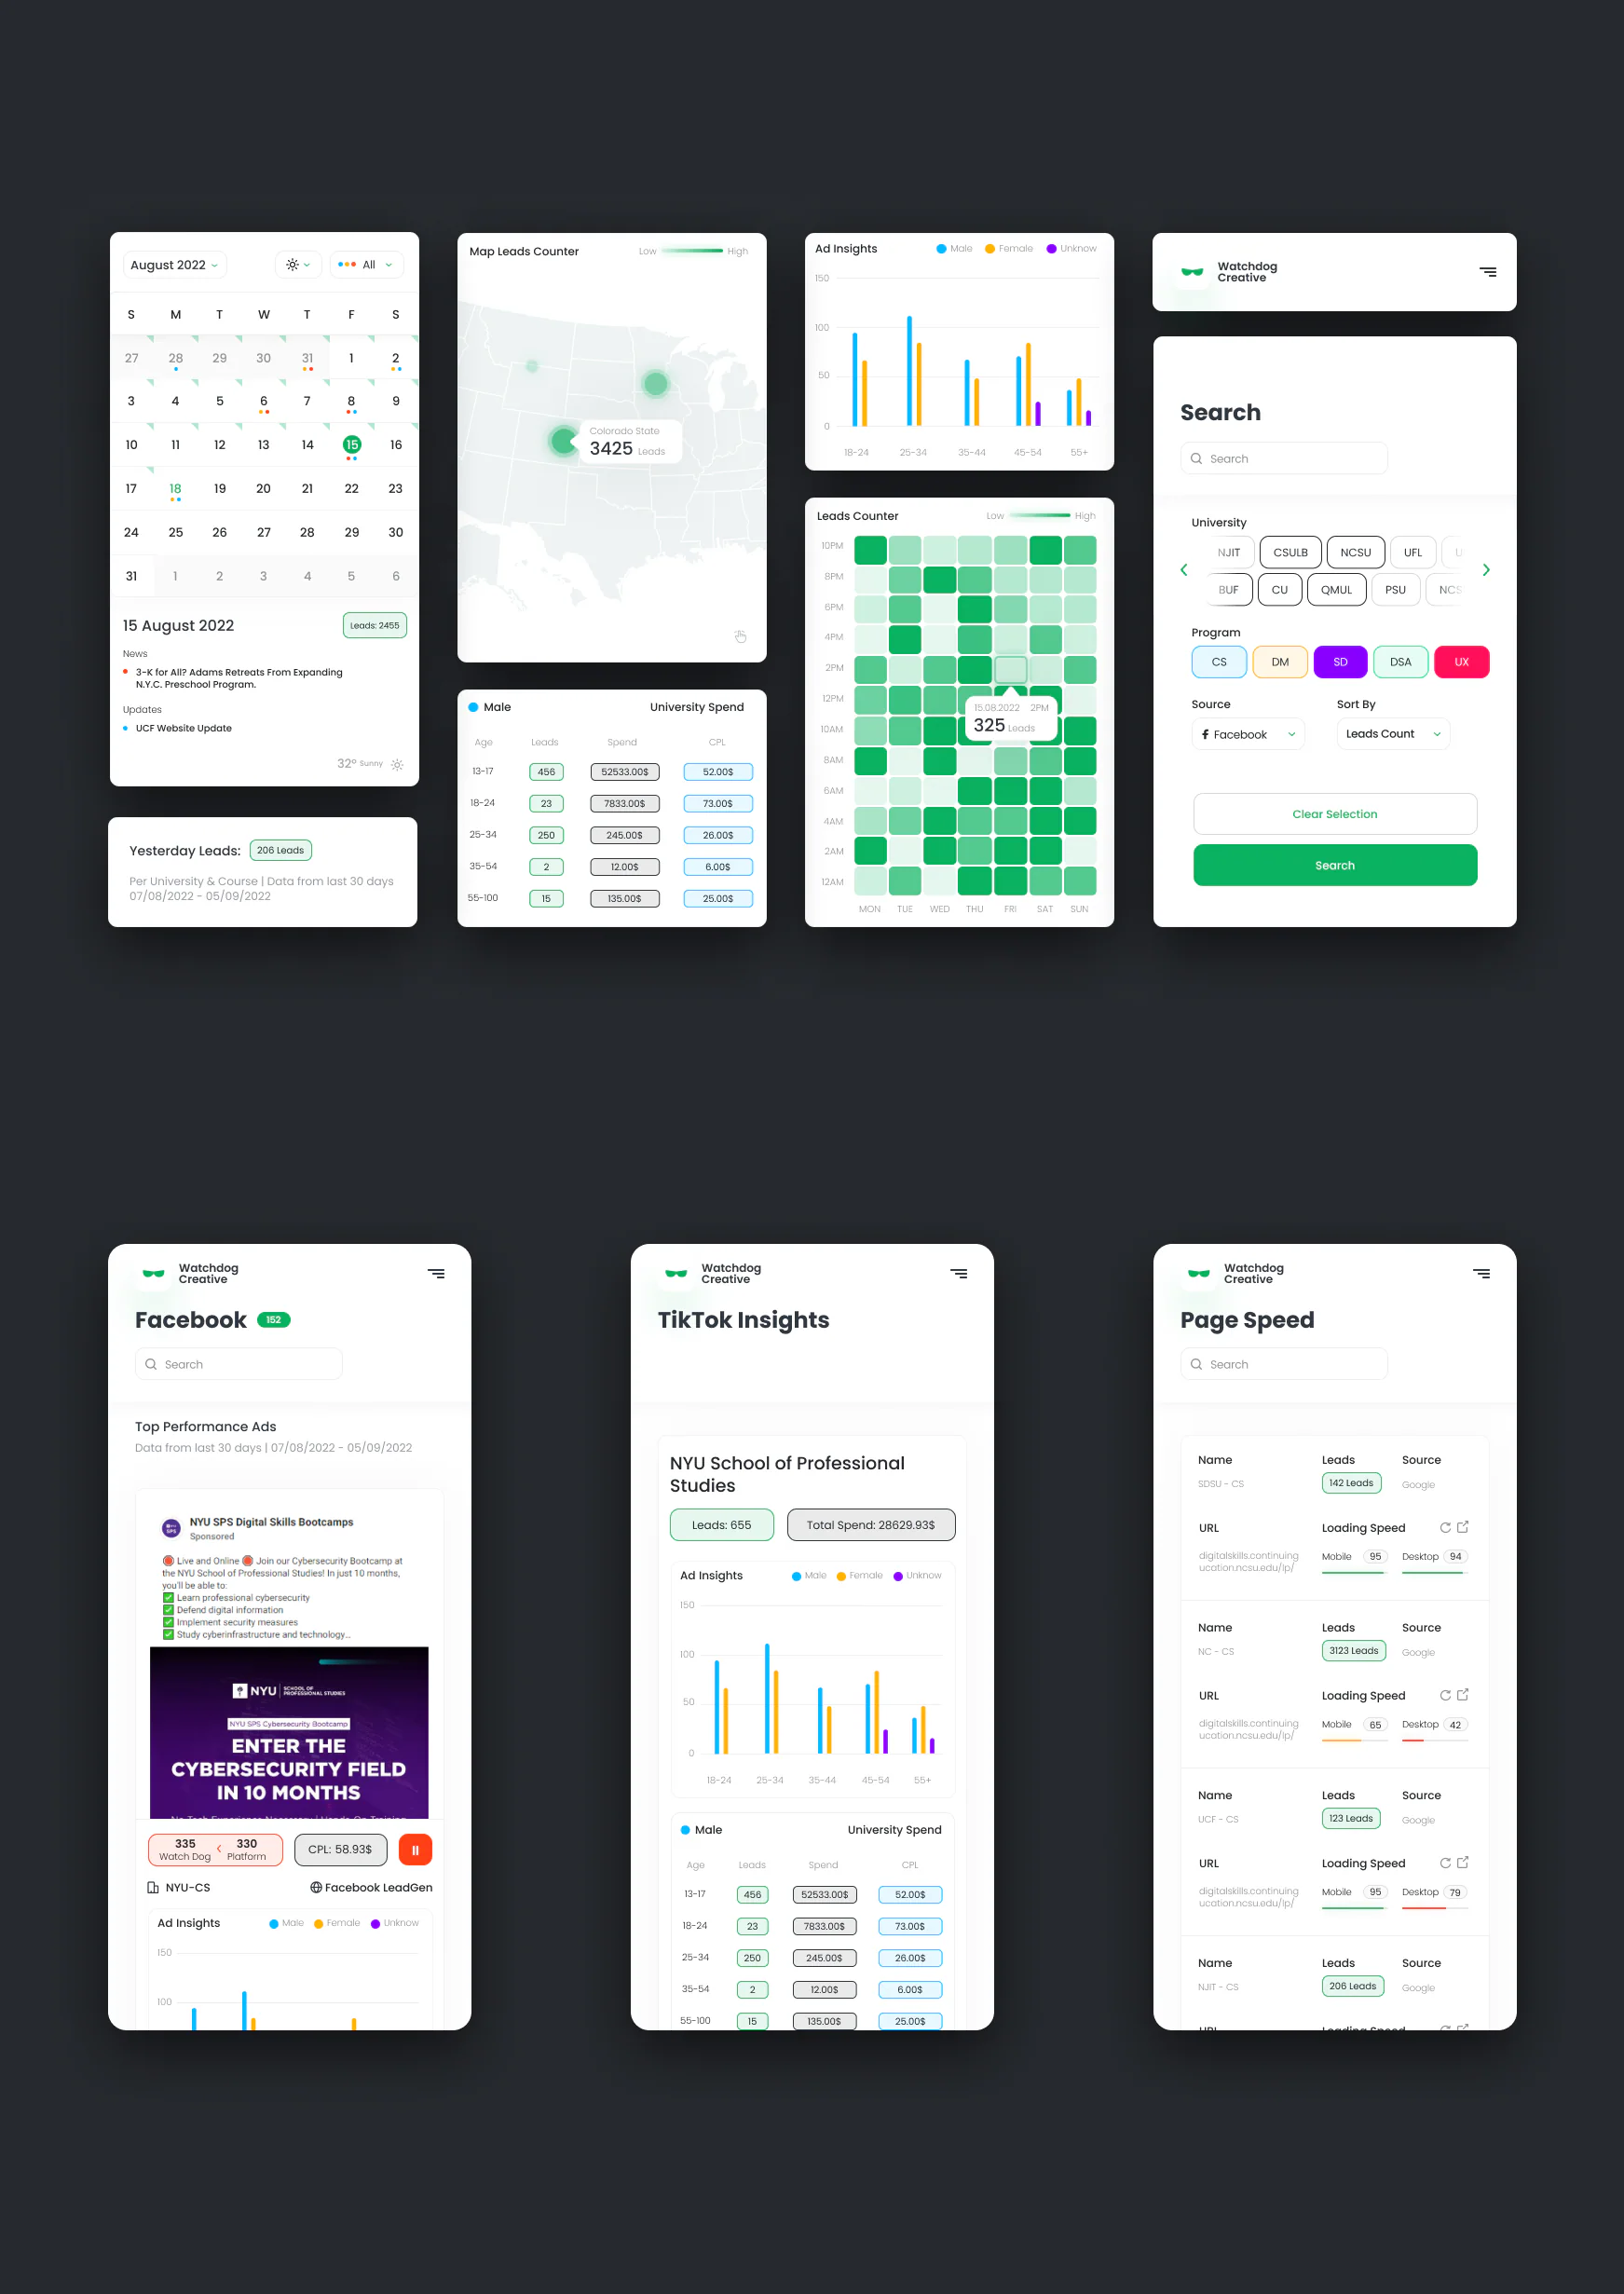
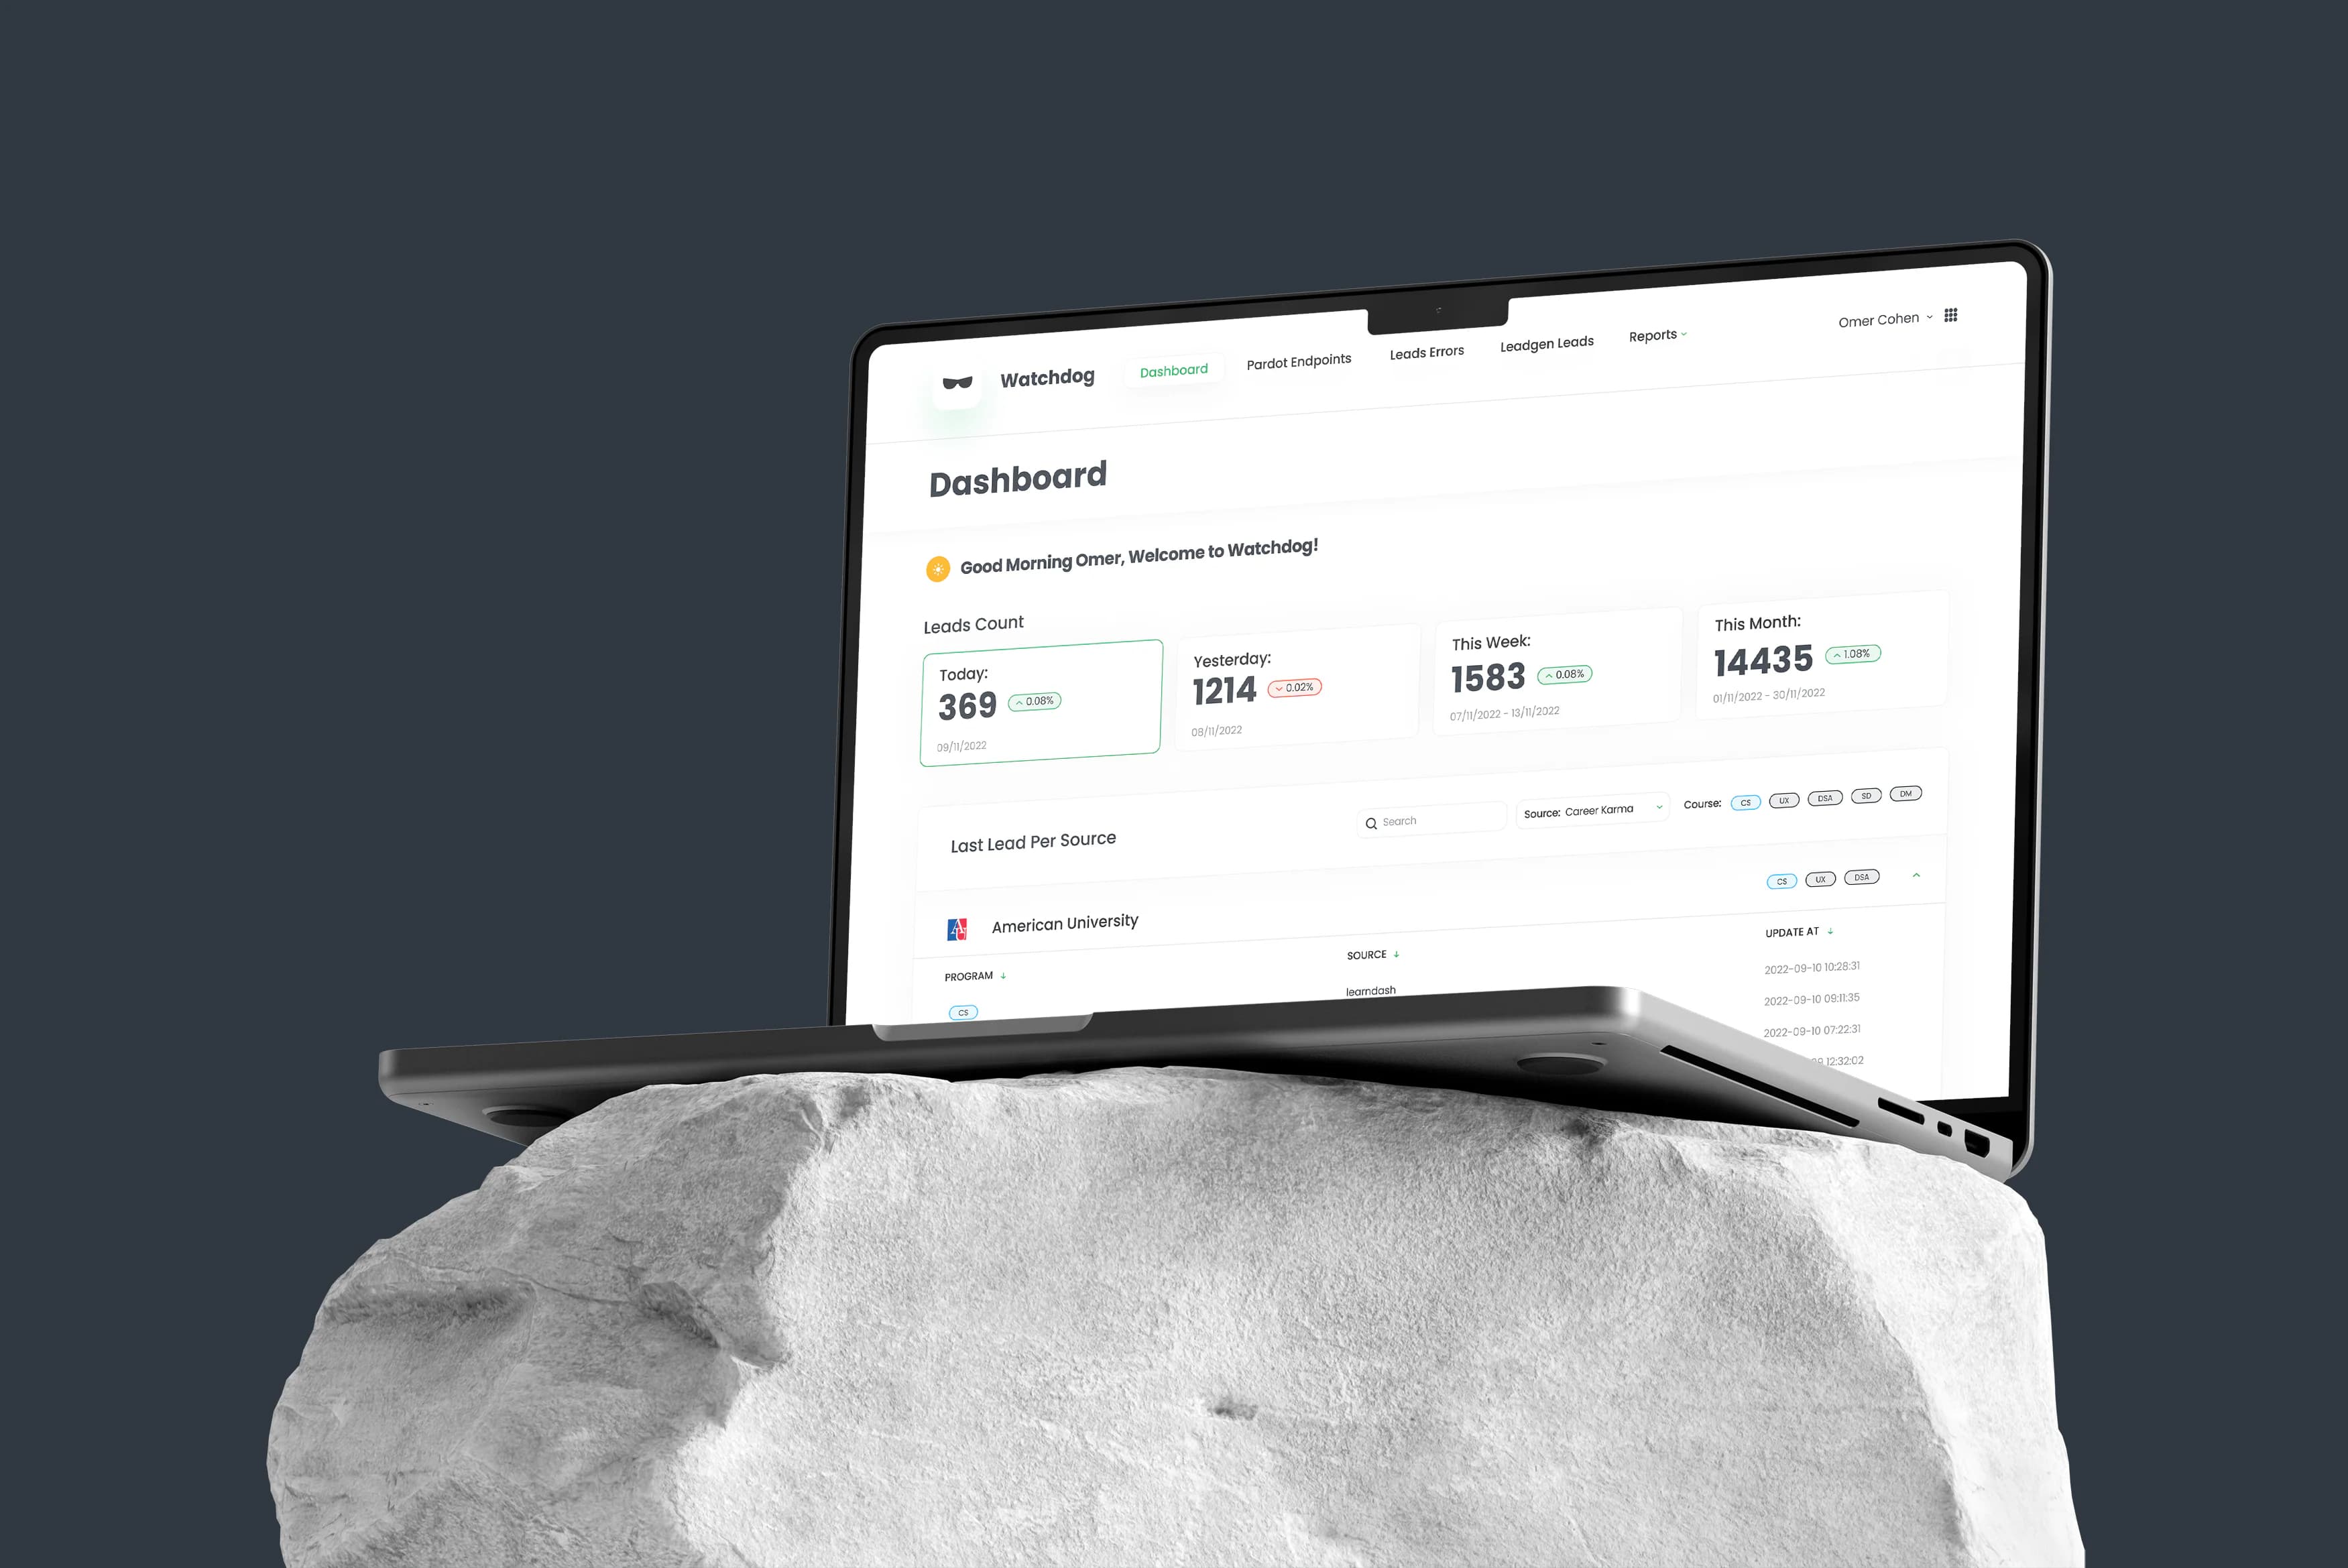
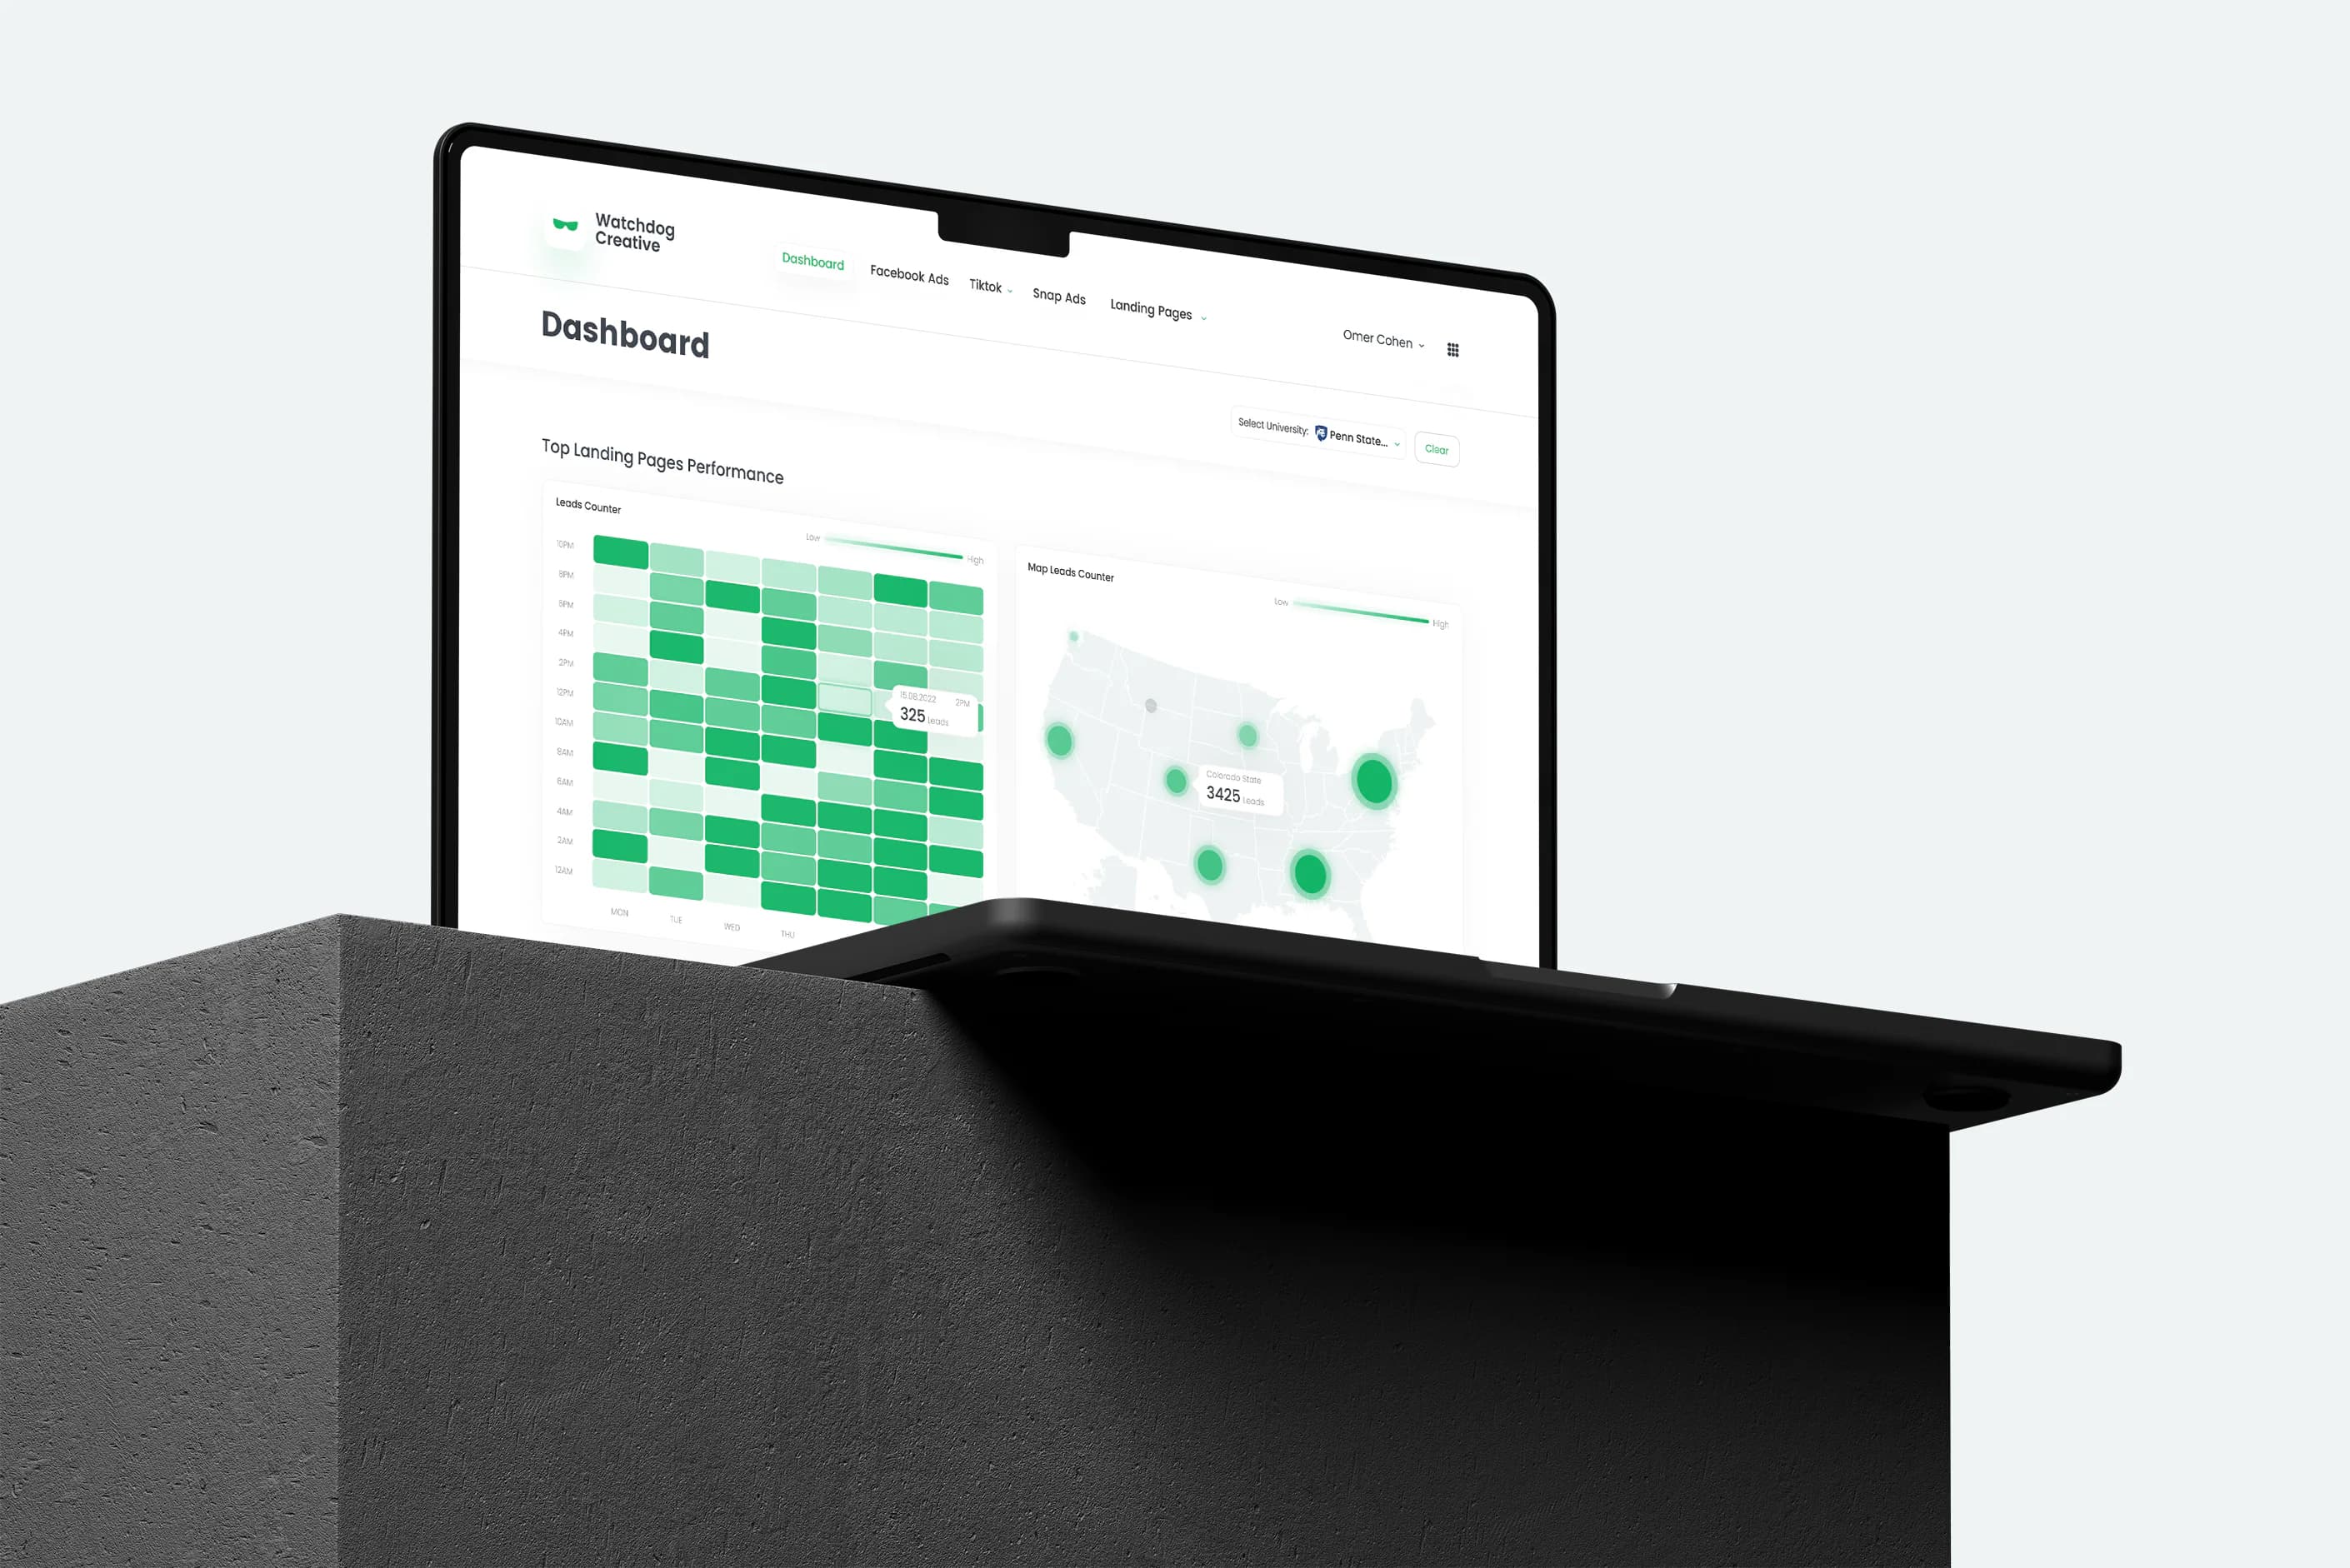
A shared visualization model put campaign health, budgets, creative performance, and execution errors into one comparable view. Teams could see where to act without first assembling separate reports.
The product needed to support decisions, not simply display analytics. The hierarchy separated health signals, performance trends, and error states so teams could move from diagnosis to action.