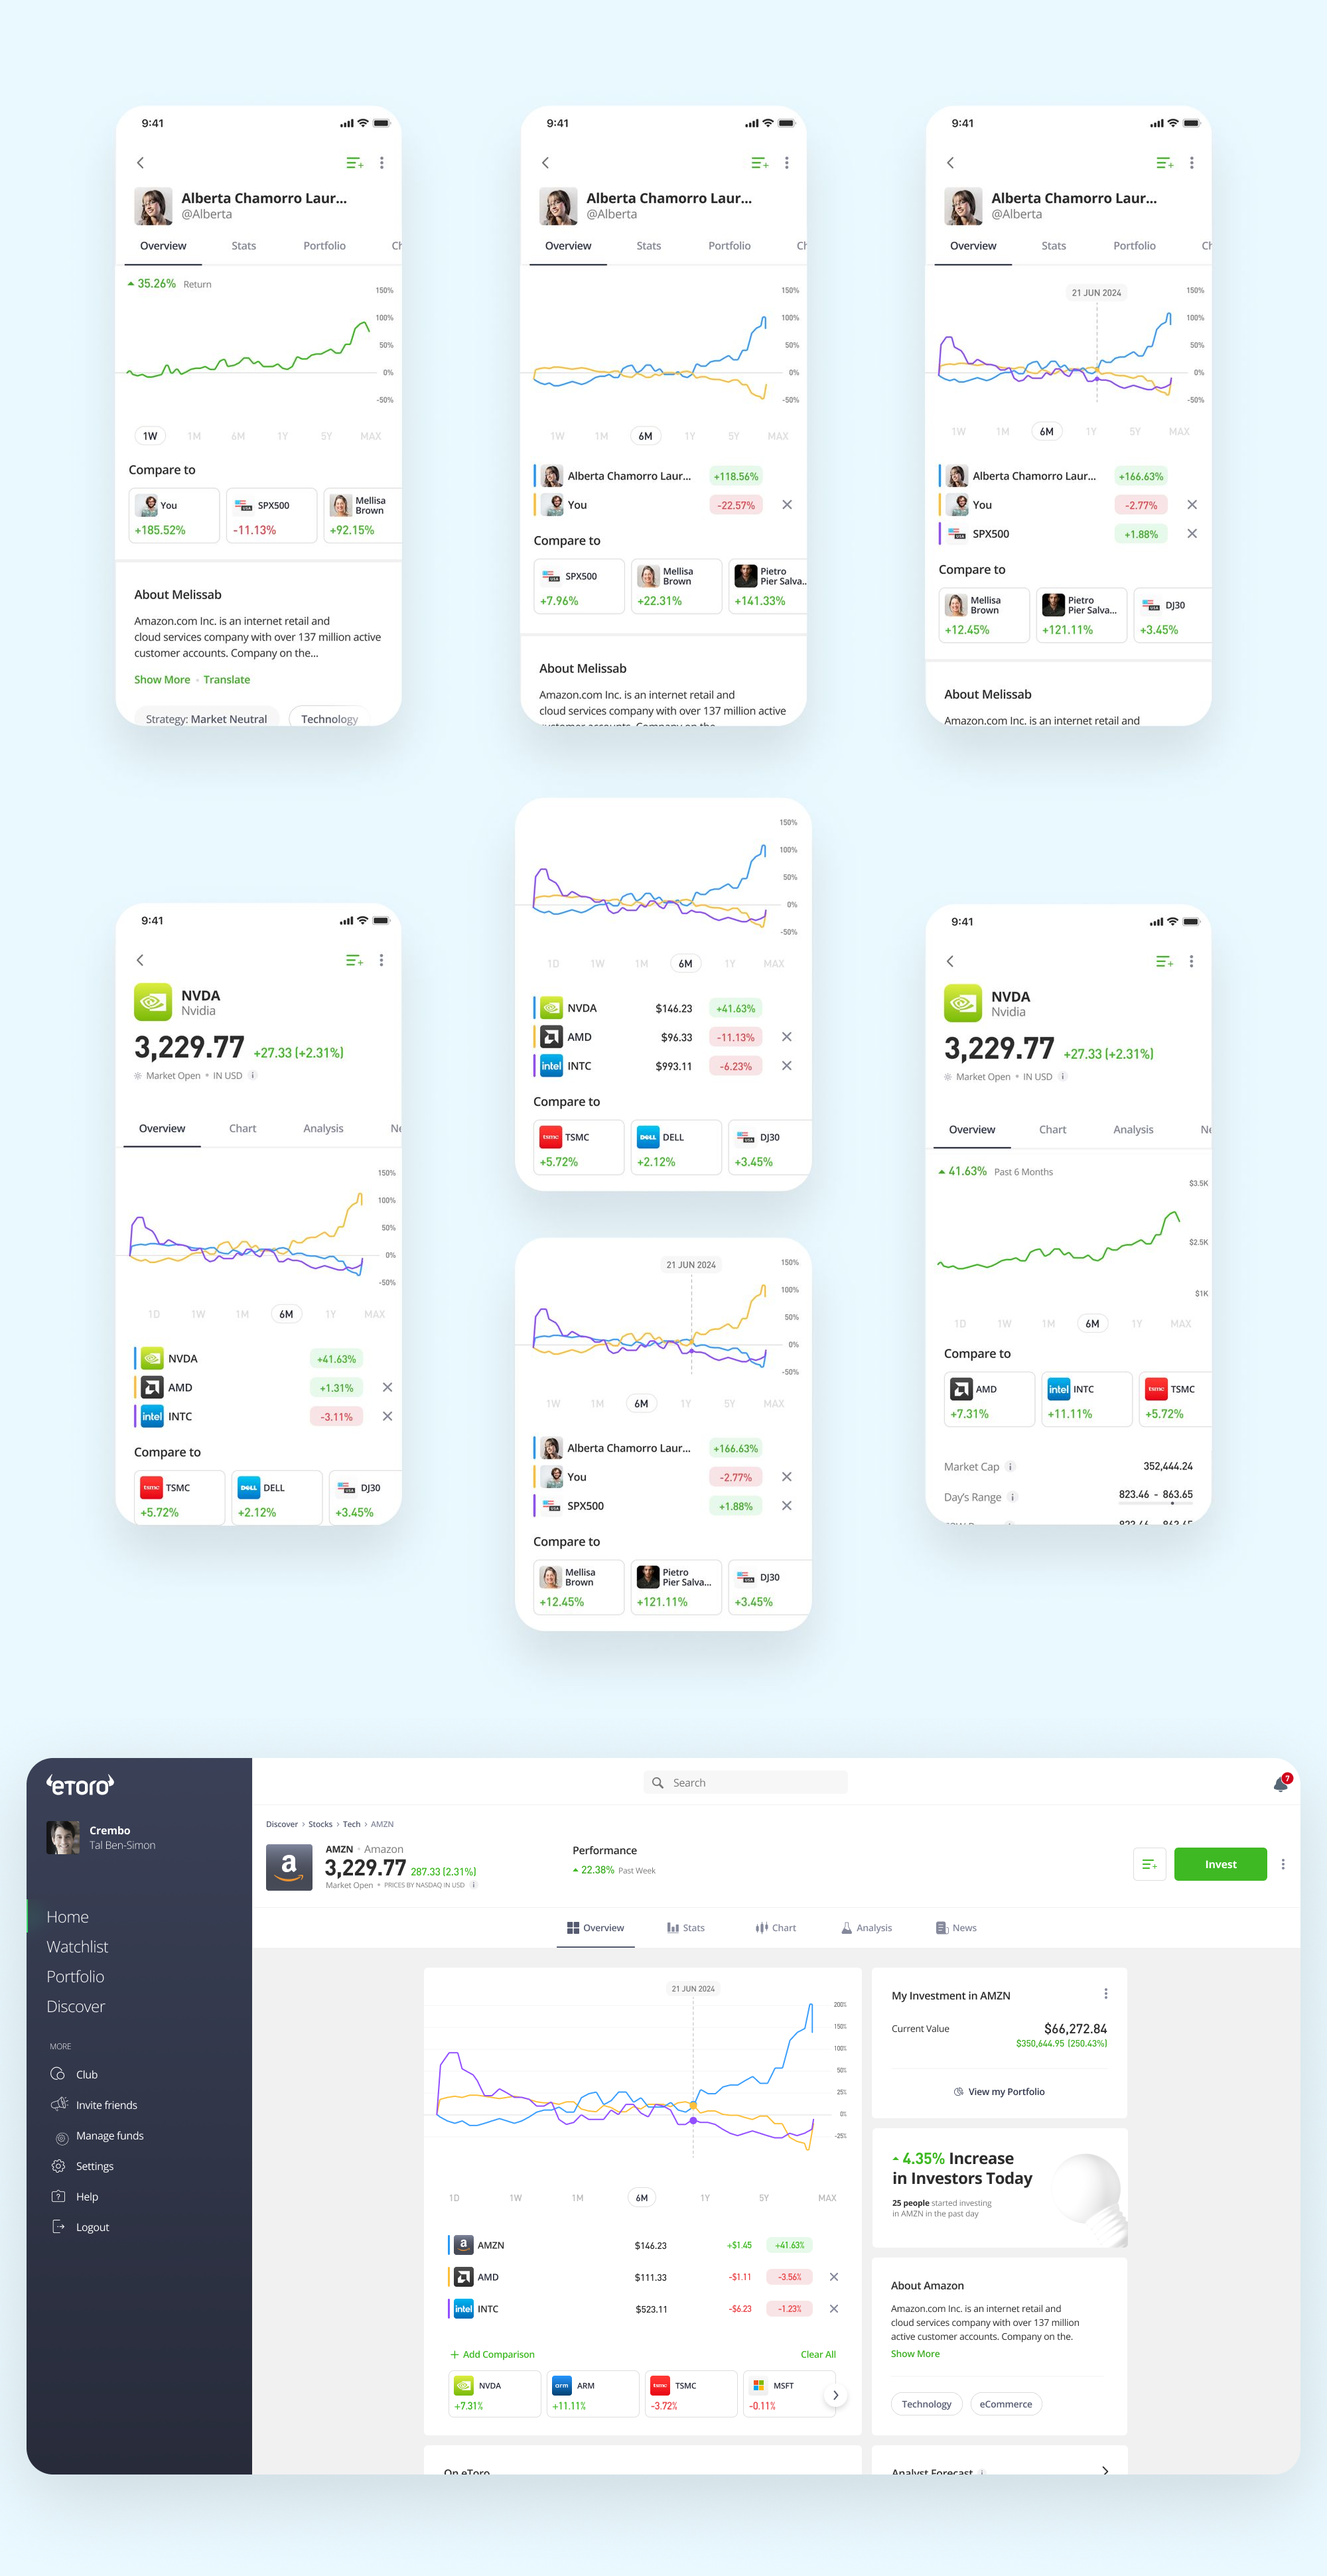
The Compare Charts feature on eToro was designed to empower users by enabling them to compare multiple assets, markets, and Popular Investors (PIs) side-by-side.
This tool simplifies the decision-making process, presenting the latest statuses and prices across different asset types and markets.
By providing professional-grade comparison tools with ease of use, Compare Charts helps users make informed investment decisions more quickly.
It also enhances PI visibility, highlighting top-performing PIs, and enabling users to evaluate asset performance effectively to support their investment strategies.
SEPTEMBER 2024
As the lead product designer and product owner for this project, my contributions included:
Senior Growth Product Designer
To address the challenges in the market exploration experience, we identified the following key issues in the problem space:
The Compare Charts feature achieved impactful results:

Through continuous user feedback via qualitative research, including interviews and testing, we sought to understand the factors that support users in making informed decisions.
We discovered that a significant portion of users' research involves comparing the performance of multiple assets before making trades. This insight drove us to take a user-centric approach, developing a feature that consolidates all necessary information onto a single page to facilitate efficient comparisons.
Applying the Opportunity Solution Tree (OST) methodology, we identified the "paradox of choice" as a key factor impacting user decision-making. From there, we conducted in-depth research to design a solution that would simplify and improve the comparison process.
Our goal was to address several key initiatives:
- In-App Research Enhancement: Enable users to conduct comprehensive asset comparisons directly within the app.
- Improved Decision-Making: Provide a structured, streamlined view that simplifies complex decision-making processes.
- Showcase PI Professionalism: Highlight PIs who outperform benchmarks, reinforcing their credibility and supporting users in identifying top performers.
- Time Efficiency: Reduce the time users spend on comparison research, allowing for faster, data-driven decisions.
To support these objectives, we developed a machine learning model on the backend that identifies relevant asset comparisons for each user. This model factors in the user’s portfolio holdings, suggests similar and uncorrelated assets, and recalls their recently viewed assets, making it easier to find relevant comparisons tailored to individual needs.